Crainiciuc and colleagues used 4D imaging of several hundreds of cells in an attempt to characterize each leukocyte at the site of inflammation. With the help of multi-dimensional datasets, they were able to develop a vast and comprehensive description of individual cells and construct what they termed as different behavioural landscapes for these cells. The information they aimed to capture from microscopic imaging to develop these behavioural landscapes was mainly on the movement and shape of several individual cells.
The authors believe that the pipelines and methods described in their paper can effectively be used to uncover and describe the identity of different leukocytes based on their morphological and kinetic cell characteristics.
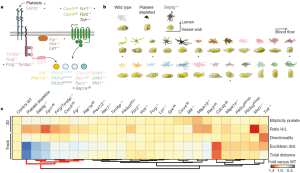
One aspect they looked at in this paper were behavioural parameters present under conditions that hinder neutrophil activation in the presence of pathogens. Some of the parameters they identified included decreased prolate shapes and cell movement. They went forward to then score whatever behavioural parameters they identified in 24 mutant mouse lines (figure 1) that were defective in genes known to play a role in various stages of neutrophil activation. Hierarchical clustering of the behavioural profiles created identified five genes that led to the loss of anti-inflammatory features.

Figure 1: Screening for drivers of pathogenic intravascular behaviours; a, Neutrophil signalling pathways, showing the genes analysed here. Control, platelet-depleted and Selplg−/− mice were used as reference groups in the screening. Asterisks denote mutants and conditions with behavioural changes similar to those in the reference groups. b, Representative 2D tracks and corresponding 3D morphologies for each condition and mutant, which are colour-coded to match the genes shown in a, including asterisks to mark the same mutants. c, Heat map of relative changes over control for the 5 selected behavioural parameters (right), for all 24 mutants and 3 reference groups, which were used as reference for protection from inflammation. Hierarchical clustering identifies five mutant behaviours that group together with the reference groups (red lines below). Data are from 3,736 cells from at least 3 mice per group and type of analysis. Mapk13 encodes p38δ and Mapk14 encodes p38γ; WT, wild type.
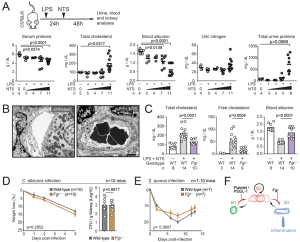
One of the genes identified was one responsible for the kinase, Fgr, which the authors chose to focus on later on in their analysis as it has not been noted in the past or in present literature to be associated with any kind of altered immune states. They saw that Fgr drove the transformation of intravascular neutrophils towards pathogenic behaviours (Figure 2) without affecting immune recruitment and anti-microbial defence. Aragones and colleagues note that such a finding demonstrates the therapeutic value of targeting specific behavioural immune traits, rather than global immune activity.

Figure 2: “Protection from nephrotoxic injury by targeting Fgr. (A) Schematic of the nephrotoxic injury model (top) and setup of conditions combining endotoxin (LPS) with increasing amounts of nephrotoxic serum (NTS), resulting in gradual increase in markers of kidney damage in serum and urine; n are number of mice per dose. (B) Transmission electron micrograph of kidney venules showing an example of intravascular occlusion in the NTS-treated mice, from 2 mice and 25–30 images analyzed. (C) Levels of the indicated metabolites in plasma of control and Fgr−/− mice before and after induction of glomerulonephritis with LPS plus NTS. The control group was treated with LPS only; n are mice analyzed per group. (D–E) Mice reconstituted with marrow from wild-type or Fgr−/− donor mice were infected with C. albicans (D) or S. aureus (E) and infection progression was measured by weight loss, and in the case of C. albicans infection by scoring the fungal load in kidneys (CFU); n are mice analyzed per group and data in (A) was analyzed by unpaired t-test. For (D–E) groups were compared by two-way ANOVA analyses for weight loss, and unpaired t-test for CFUs. Data in (C) was analyzed by one-way ANOVA with Tukey’s multiple comparisons test. (F) Scheme modeling neutrophil states, transitions, and delivery of inflammatory signals to the host tissues from B3 cells. Each transition is proposed to be caused by different signals, e.g. delivered by platelets and PSGL-1 for initial transition from B1 to B2, and via Fgr for transitions from B2 to B3. The number of replicates (n) per group is indicated in each panel.”
The authors had this to say about some of the results from this paper; “Ultimately, behavioural profiling in vivo can guide the identification of pathogenic and non-pathogenic immune states and their underlying molecular switches, as illustrated here by the identification of Fgr as a driver of pathogenic neutrophils and vascular inflammation”.
Journal article: Crainiciuc, G., et al., 2022. Behavioural immune landscapes of inflammation. Nature.
Summary by Vanessa Muwnanga


