


For over 30 years, scientists have focused on clearing sticky amyloid beta plaques from the brains of Alzheimer’s patients. These toxic protein clumps have long been viewed as the key culprit in driving the disease. A new study suggests a novel shift in strategy: instead of relying solely on drugs to clear plaques, researchers propose enhancing the brain’s own immune cells to do the job more effectively (Figure 1). The study offers fresh hope for more effective, longer-lasting Alzheimer’s treatments.
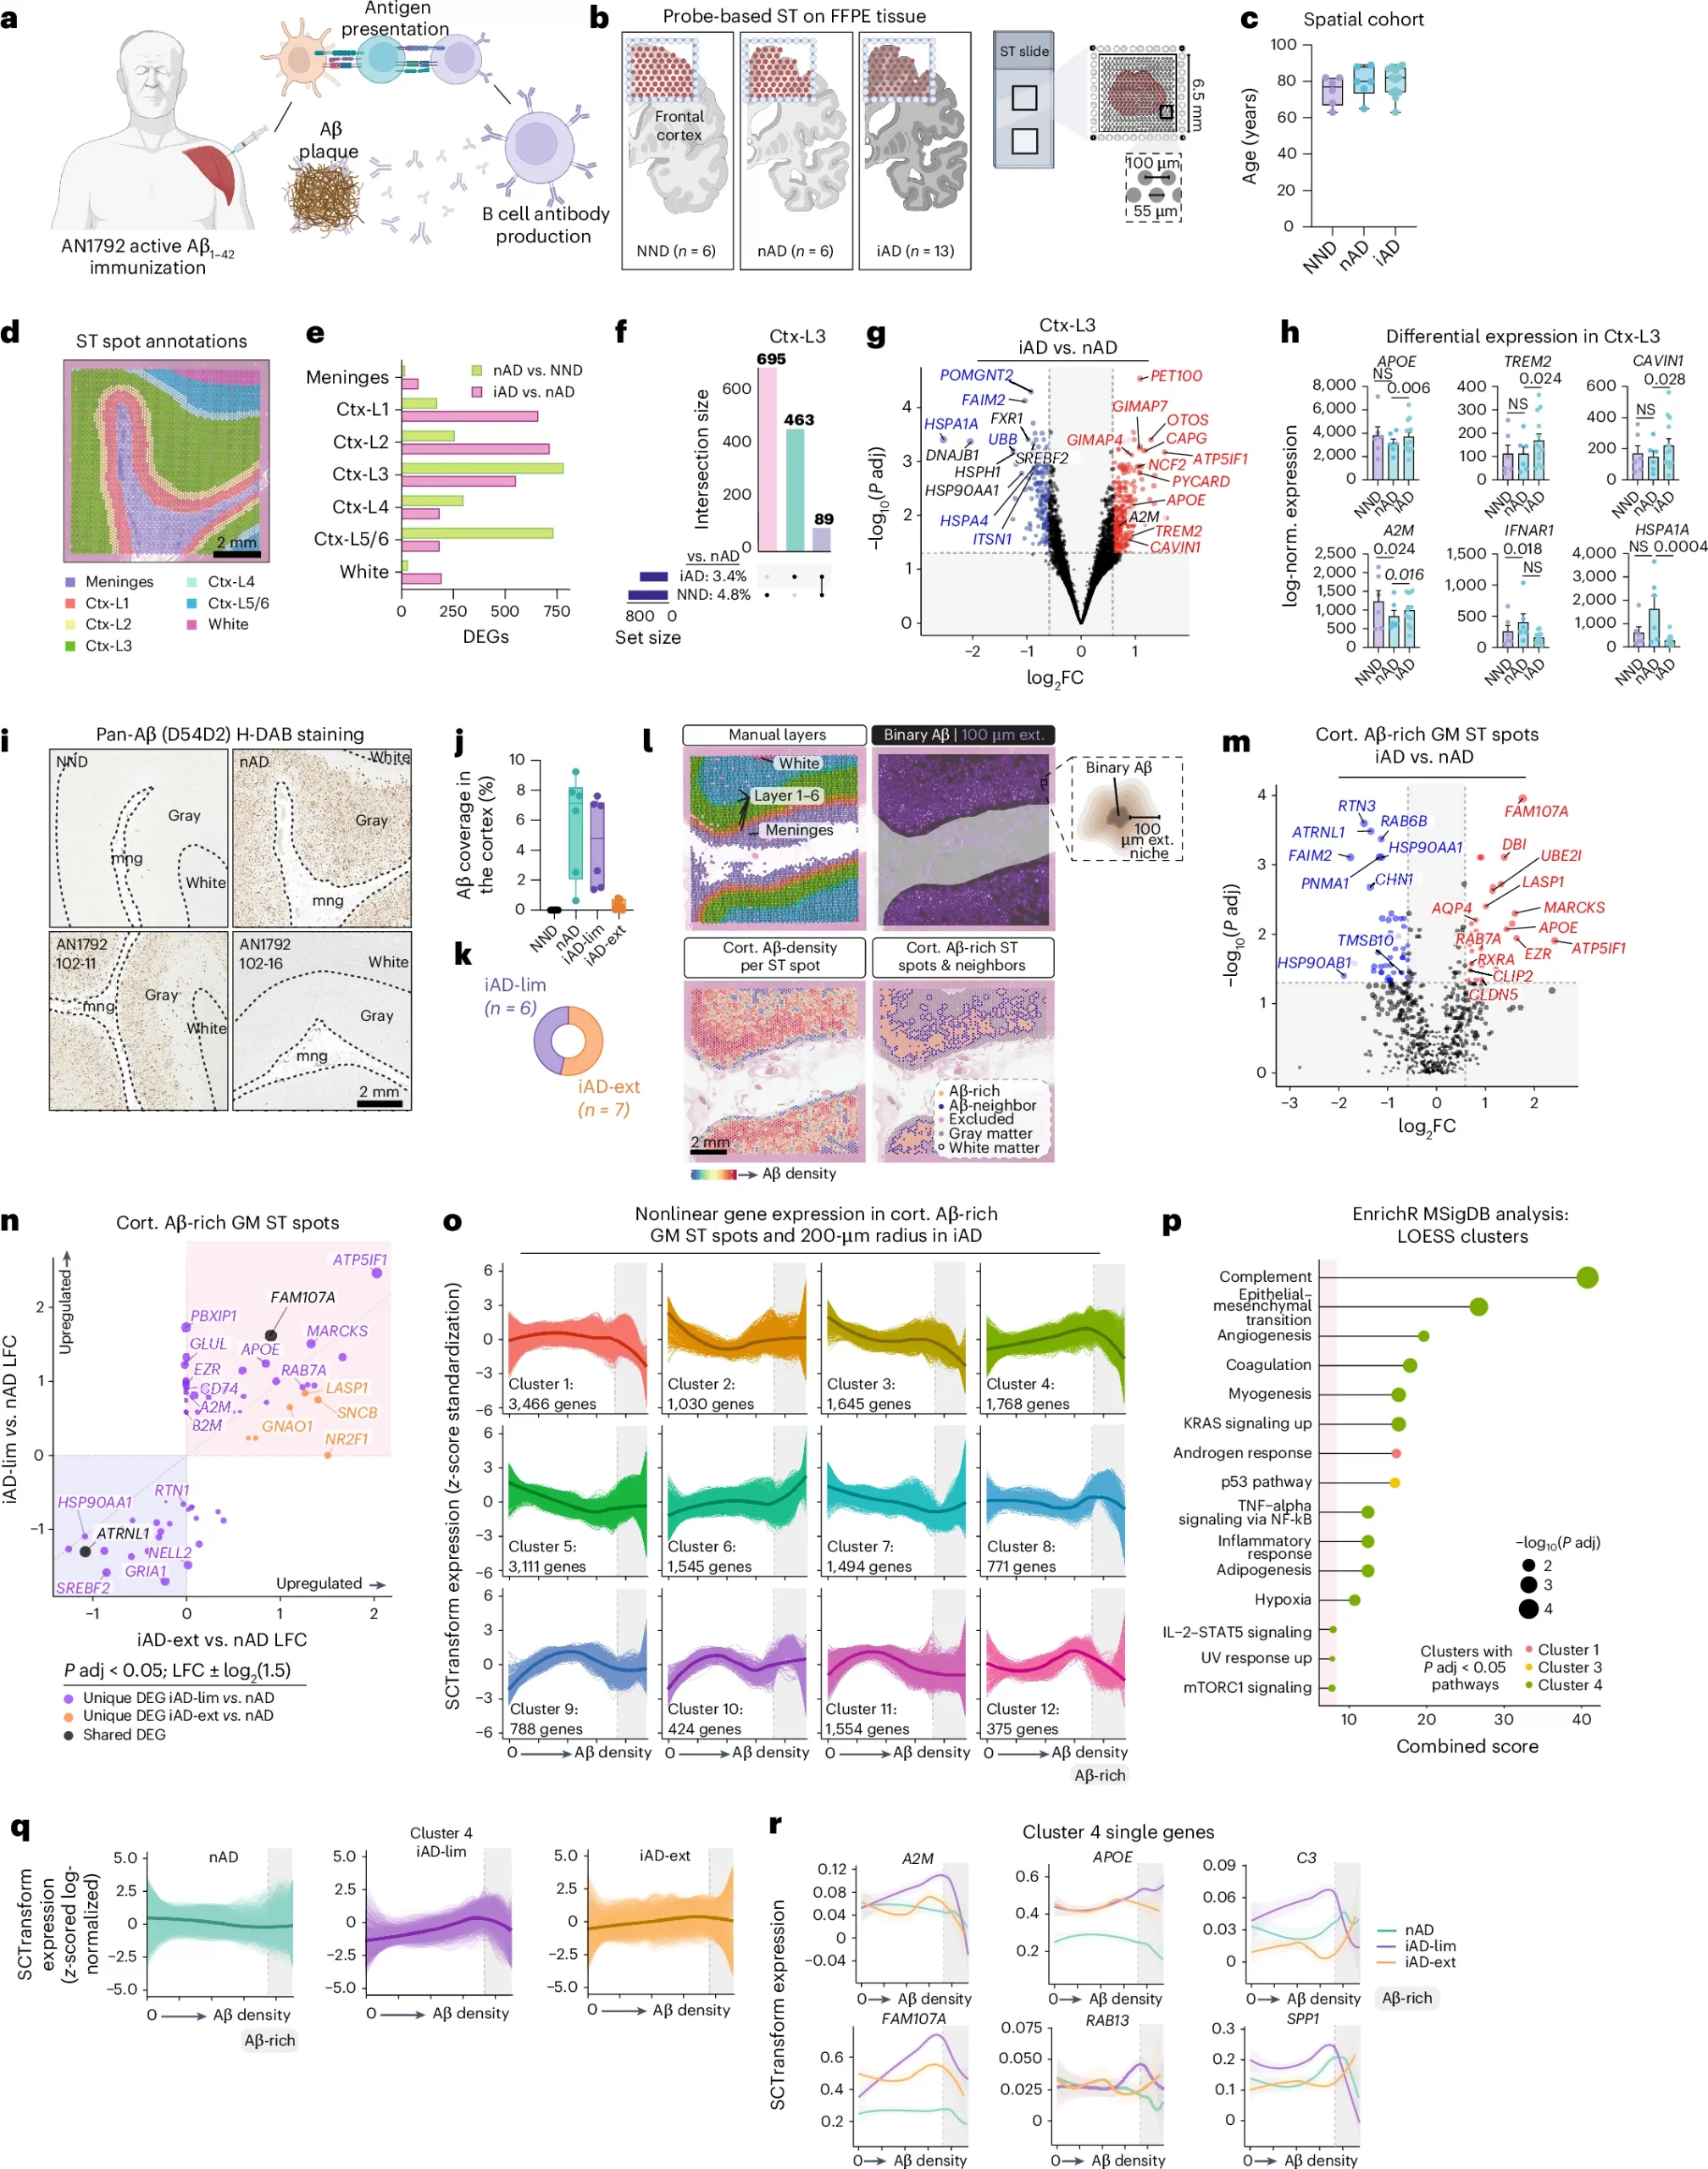
Figure 1: Active Aβ immunization sustains inflammation at the Aβ niche. a, AN1792 active Aβ immunization. Created with BioRender.com. b, ST method and group sizes of NND, nAD and iAD FCX tissues. Created with BioRender.com. c, Study demographics indicating age of each patient. d, Manually annotated ST spots in the FCX. e, Number of DEGs for each comparison per manually annotated area. f, UpSet plot showing unique and shared DEGs across group comparisons in cortical layer III. g, DEGs in cortical layer III (iAD versus nAD). Red and blue DEGs are uniquely identified in the iAD versus nAD comparison and are not observed as DEGs in the nAD versus NND comparison. h, Pseudobulked expression for various genes in microglia-enriched gray matter ST spots. Error bars indicate the s.e.m. P values are from DESeq2. i, Representative pan-Aβ H-DAB stains for each group. j, Quantification of cortical Aβ coverage per group. k, Numbers of iAD-lim and iAD-ext patients among AN1792 actively immunized patients. l, Method of processing of Aβ IHC images. The binary Aβ signal was extended by 100 μm beyond its actual size, with a gradual decrease in signal intensity every 20 μm, allowing for detection of genes associated with Aβ density. m, DEGs from Aβ-rich gray matter ST spots (iAD versus nAD). n, LFC plots for Aβ-rich ST spots in gray matter (iAD-lim versus nAD; iAD-ext versus nAD). o, LOESS plots showing clusters of nonlinear gene expression patterns relative to Aβ density in iAD. p, Pathway enrichment analysis of genes in nonlinear expression clusters associated with Aβ density in iAD. q, LOESS plot of cluster 4 predictions in nAD, iAD-lim and iAD-ext relative to Aβ density. r, LOESS plots of select genes in LOESS cluster 4. Dark line indicating the LOESS predicted expression, and light shading represents standard error of the estimated values. c,j, Box plots are bounded by the 25th and 75th percentiles, the center line shows the median, and whiskers show the data range. o,q, LOESS plots with the dark line represent the mean LOESS predicted expression per group per cluster, and single lines indicate LOESS predicted gene expression per group per cluster. c,e–h,j,k, NND = 6; nAD = 6; iAD = 13; iAD-lim = 6, iAD-ext = 7. m,n, nAD = 4; iAD = 10; iAD-lim = 6, iAD-ext = 4. o–r, nAD = 4; iAD = 12; iAD-lim = 6, iAD-ext = 6. DESeq2 (e–h) or MAST (m and n) was used to compare expression levels. For DESeq2, covariates included sex, age, average genes detected and genomic DNA (gDNA) percentage. In MAST, manually annotated region or cortical layer, sex, age, cellular detection rate (CDR) and gDNA percentage were included as covariates, with sample ID as a random effect. All P values were false discovery rate (FDR)-adjusted using Benjamini–Hochberg correction. A2M, alpha-2-macroglobulin; APOE, apolipoprotein E; CAVIN1, caveolae-associated protein 1; Ctx, cortex; FFPE, formalin-fixed paraffin-embedded; GM, gray matter; HSPA1A, heat shock protein family A member 1A; H-DAB, hematoxylin-3,3′-diaminobenzidine; IFNAR1, interferon alpha and beta receptor subunit 1; LFC, log fold change; MSigDB, Molecular Signatures Database; P adj, adjusted P value. NS, not significant.
While several FDA-approved antibody drugs target amyloid beta plaques, their impact on the disease has been modest, often accompanied by serious side effects and steep costs. The findings open the door to a potentially transformative approach: harnessing and enhancing the brain’s natural immune defences to fight Alzheimer’s more efficiently.
The study zeroes in on microglia, the brain’s resident immune cells. Microglia are responsible for clearing debris and maintaining healthy brain tissue. In Alzheimer’s, some microglia spring into action to remove harmful amyloid plaques, while others struggle to do so.
By analysing post-mortem brain tissue from individuals who had participated in clinical trials of amyloid-beta immunization, they were able to map gene activity in specific areas of the brain. One major takeaway from the study is that microglia don’t just clear plaques—they also play a role in healing the brain after plaques are removed. The research identified specific genes, including TREM2 and APOE, that are more active in microglia that successfully clear plaques. These genes seem to drive the protective behaviours of microglia, suggesting a genetic blueprint for more effective immune responses.
The team found that brain immune cells play a crucial role in the success or failure of these therapies. Understanding the genetic and molecular factors behind these differences could guide future treatments—and maybe even predict who will respond best to immunotherapy.
This new research signals a potential paradigm shift in Alzheimer’s treatment. Instead of focusing solely on removing amyloid plaques, future strategies might focus on empowering the brain’s own immune system to tackle the disease more effectively and safely.
Journal article: van Olst, L., et al., 2025. Microglial mechanisms drive amyloid-β clearance in immunized patients with Alzheimer’s disease. Nature Medicine.
Summary by Stefan Botha